

In this example, May had the most left over.
You earned about what you always do. You just spent less than any other month all year.
JFMAMJJASOND
 LEDGR
LEDGR is a Canadian budgeting app for web and iPhone. Review bank or CSV imports, understand your spending, and build your monthly Spending Plan.
A 14-day trial is available on eligible plans.
Price, trial eligibility, renewal, and cancellation terms are shown before you start.
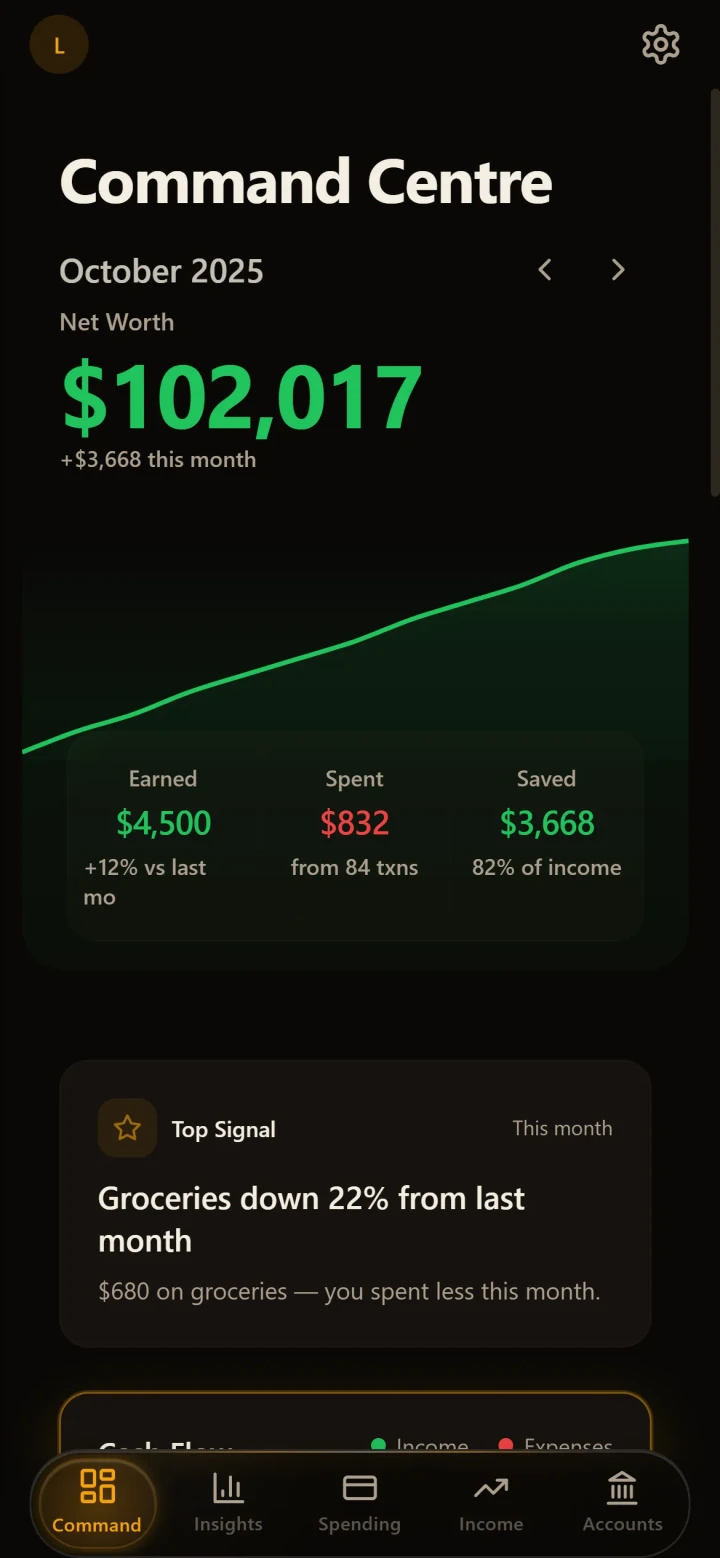
Groceries down 22%
from last month
Illustrative demo data. Your figures and results will differ.
CSV
import bank exports
Rules
reuse category mappings
12 mo
explore what-if projections
Tools for understanding your own numbers
Your bank shows you this
LEDGR shows you this
Cryptic codes. No context. No categories.
Just a wall of numbers that tells you nothing.
Every line named.
Two of these are worth cancelling.
You deserve to see this
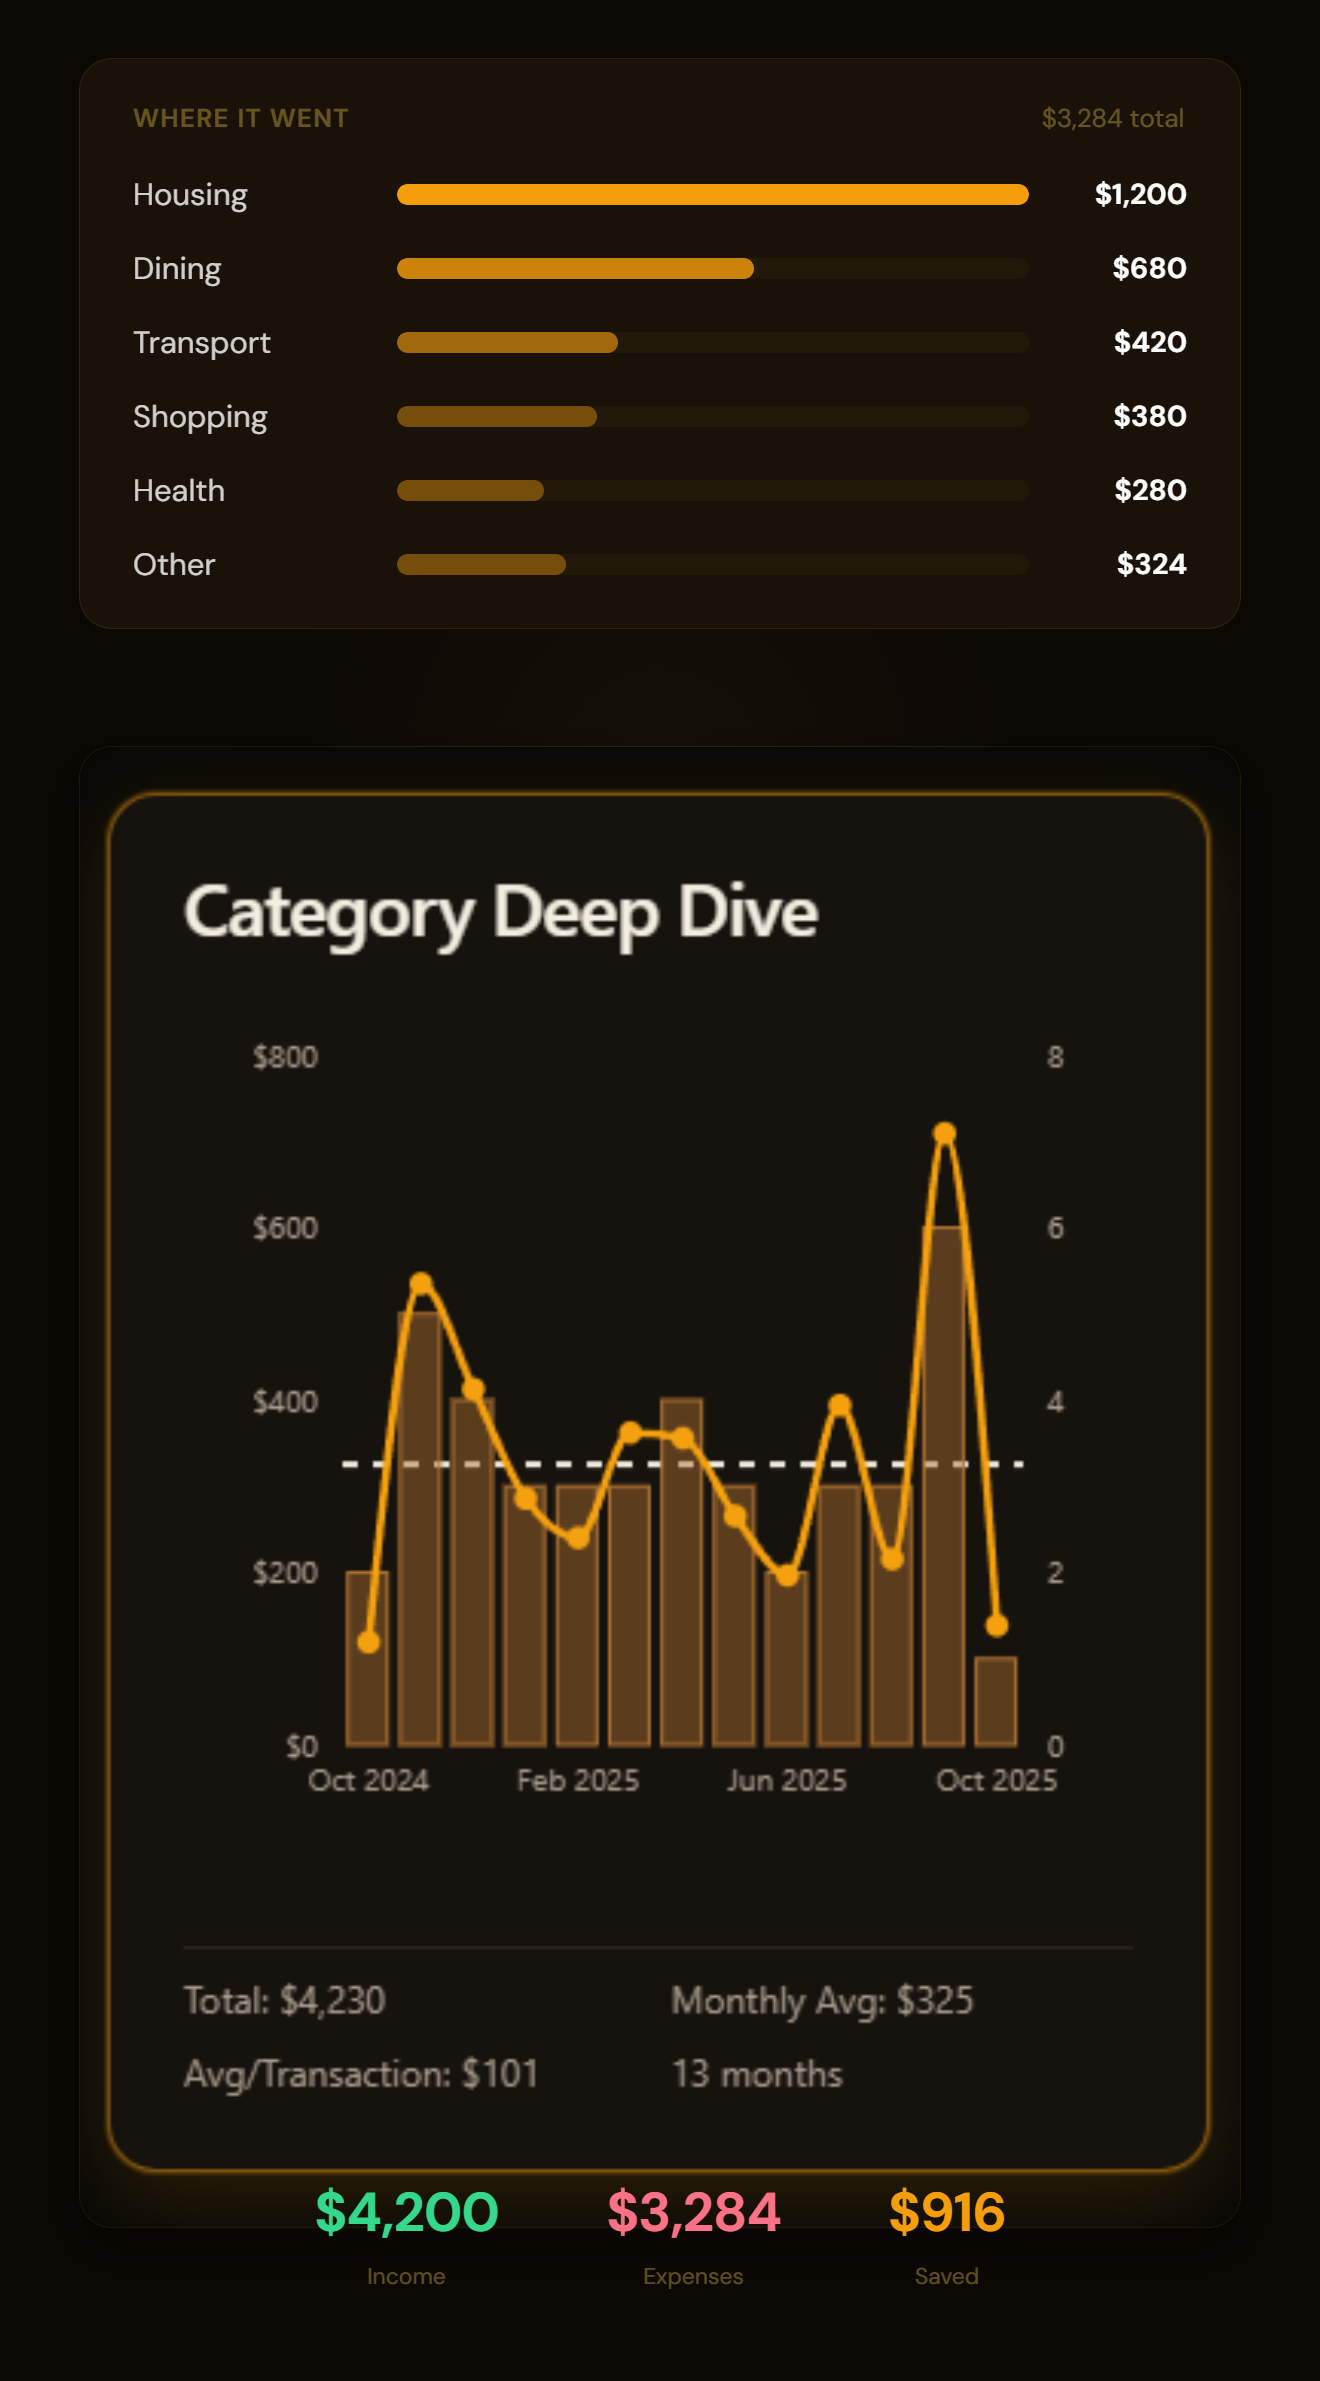
Illustrative demo with fictional data. These are not customer results or guaranteed savings.
Use your own transaction history to see how income, spending, and money kept change over time.
Move a slider to compare a spending scenario with the example baseline. The dotted line stays put so you can compare the two estimates.
Illustrative demo with fictional data. Assumes constant monthly income and spending over twelve months, with no investment returns. Projections are estimates, not guaranteed savings.
Example workflows to try in LEDGR.
Import, review, then explore your monthly Spending Plan and insights.
Product demos use illustrative data, not customer results.
Check your bank in the Plaid connection flow, or import a CSV bank export. Availability and reauthentication vary by institution and account. CSV imports are staged for review; check ledger activity after connecting a bank.
Product demo with illustrative data, not customer results.
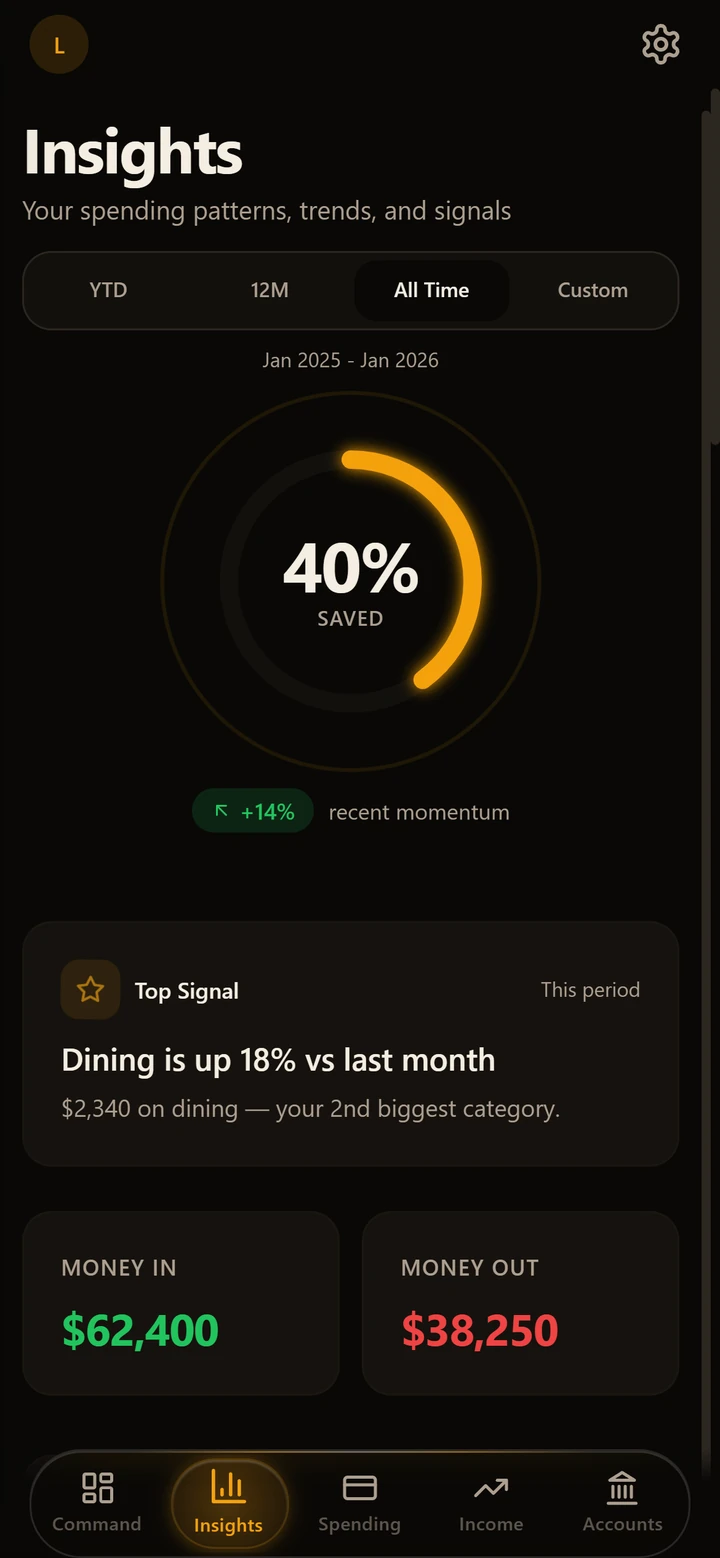
Spending shifts, savings momentum, and the one signal that matters.
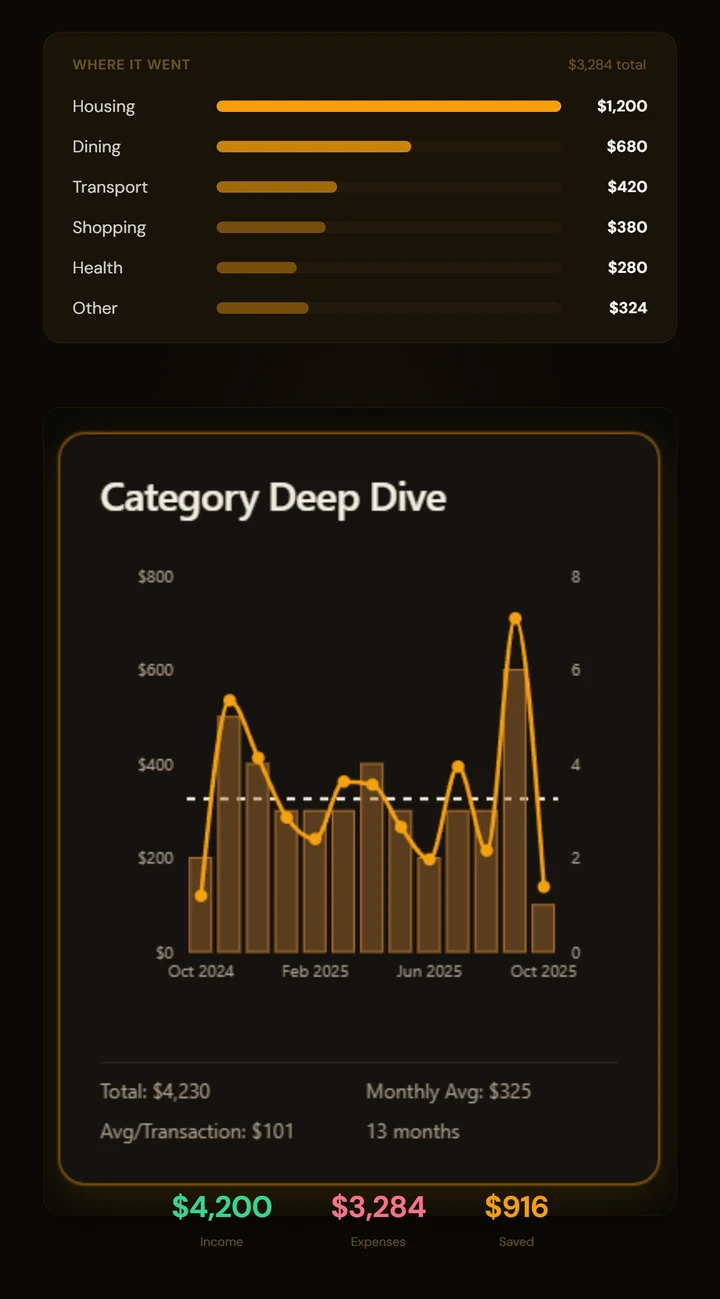
Category breakdowns, trends, and intelligence that compounds over time.
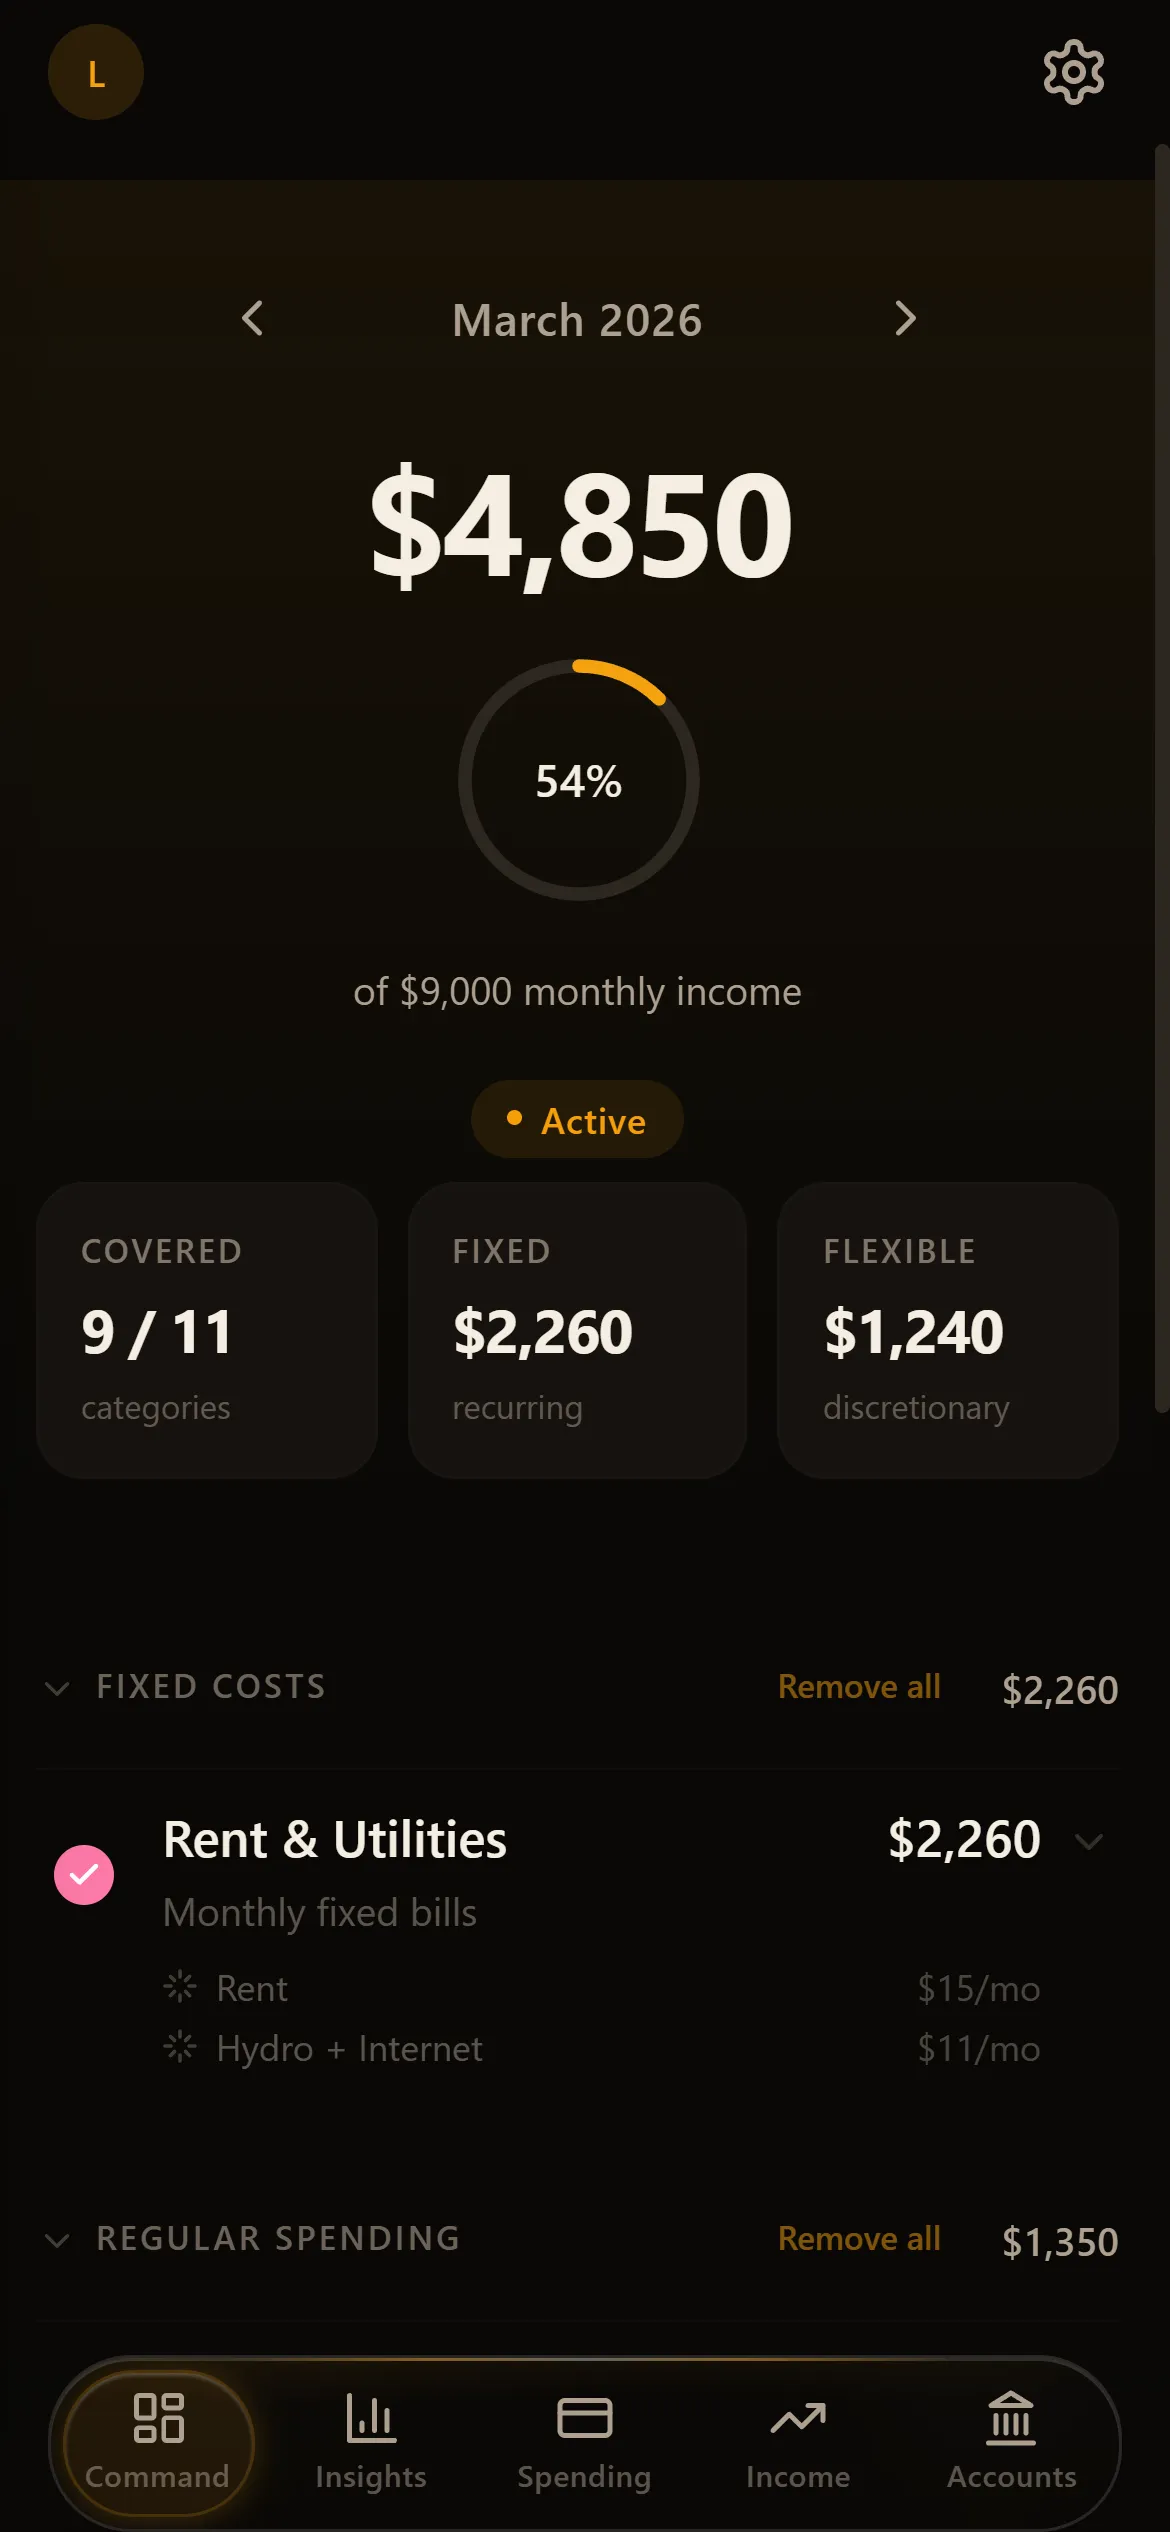
Set budgets by category. Track where you stand in real time.
Your bank shows you transactions. LEDGR tells you what they mean: where your spending shifted, whether you are saving more, and the one thing worth knowing this month.
Set budgets by category and track where you stand in real time. No spreadsheets, no guesswork. Just a plan that keeps itself up to date.
9 of 11 categories
covered
54% of $9,000 income planned
Explore eligible trial plans →
Start with your own records. Explore the questions that matter to you.
Review spending by category and merchant, using the transactions you have added to your ledger.
See how much of your recorded income remains after spending, and compare your savings rate across months.
Review recurring charges in your transaction history and decide which services you still want to keep.
Adjust spending assumptions in Time Machine to compare estimated paths over twelve months. Actual results depend on your income and spending.
See what you earned, what you spent, and what you actually kept. Told like a story instead of a spreadsheet.
Illustrative recap with fictional data. These are not customer results or guaranteed savings.
You earned about what you always do. You just spent less than any other month all year.
This fictional example compares savings rates at two points in the year.
of everything you earned
See what changed. See what it changes.
Make sense of the last few months, and see the next twelve as a projection.
US$9.99 a month, or US$99.99 a year.
A 14-day trial is available on eligible plans.
Web pricing in US dollars. Check the checkout or App Store sheet for the price, currency, and renewal terms before confirming.
Trial eligibility and cancellation terms are shown before you start.
Prefer your phone? Get LEDGR for iPhone.
Download on the App StoreNo ads. We do not sell your financial data. Privacy policy
LEDGR is published by Ledgr Financial Inc. The iPhone app is listed as LEDGR Money on the App Store. LEDGR is available on the web and on iPhone.
LEDGR offers a 14-day trial on eligible plans. Web pricing is US$9.99 a month or US$99.99 a year. The checkout or App Store sheet shows the current price, currency, trial eligibility, renewal period, and cancellation terms before you start. Public web signup may be unavailable; check the iPhone app for signup options.
LEDGR uses read-only Plaid connections and cannot move money. LEDGR does not sell your financial data or run ads. You can disconnect a bank connection or request account deletion. The Privacy policy explains how your data is stored and processed.
You can review imported transactions, assign categories, and reuse your choices through merchant mapping rules. CSV imports go through staging for review. Plaid onboarding can add imported transactions automatically, so check the ledger and categories after connecting.
LEDGR uses Plaid for bank connections. Availability and reauthentication vary by institution and account. Check your bank in the connection flow; if it is unavailable, you can import a CSV bank export and review the transactions before adding them to your ledger.
Yes. LEDGR runs on the web and on iPhone, and it is the same account either way. Check one number in the queue for coffee, or sit down with the whole picture on a laptop on Sunday.
LEDGR combines bank or CSV imports, category and exclusion controls, and a monthly Spending Plan. Review imported activity in your ledger, use Insights and Top Signal to understand it, and explore estimates in Time Machine. CSV imports are staged for review; Plaid onboarding can add transactions automatically.